MELODIC - User Guide
(Multivariate Exploratory Linear Optimized Decomposition into Independent Components)ICA-Based Model-Free Analysis of 4D Data
MELODIC Version 2.0
MELODIC - User Guide(Multivariate Exploratory Linear Optimized Decomposition into Independent Components)ICA-Based Model-Free Analysis of 4D Data MELODIC Version 2.0 |
MELODIC (Multivariate Exploratory Linear Optimized Decomposition into Independent Components) uses ICA (Independent Component Analysis) to decompose 4D data (for example FMRI data) into different interesting spatial and temporal components. It can pick out different activation and artefactual components without any model being specified. Thus the output is a new 4D data set (each volume being a separate spatial component) and a text file of separate time courses (temporal components).
For more detail on MELODIC and an updated journal reference, see the MELODIC research web page. If you use MELODIC in your research, please quote the journal reference listed there.
The different MELODIC programs are:

Press Select 4D data and select the input data.
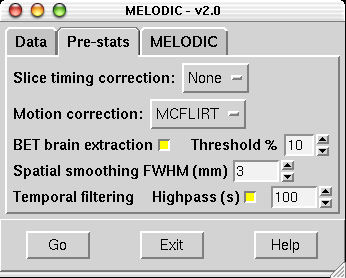
Low-frequency drifts and motion in the data can adversely affect
the decomposition. In most cases, you would want to motion-correct the
data and remove these drifts first. This can be done from within the
Melodic GUI Pre-stats section.
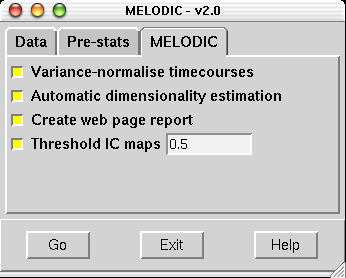
By default, Melodic will automatically estimate the number of components from the data - you can switch this option off and then can specify the number of components explicitly.
Melodic will also by default carry out inference on the estimated maps using the mixture model approach. A threshold level of 0.5 in the case of alternative hypothesis testing means that a voxel 'survives' thresholding as soon as the probability of being in the 'active' class (as modelled by the Gamma densities) exceeds the probability of being in the 'background' noise class. This threshold level assumes that you are placing an equal loss on false-positives and false-negatives. If, however, you consider e.g. false-positives as being twice as bad as false-negatives you should change this value to 0.66...
Now simply press Go
Melodic will then generate the results and
your terminal window will tell you where to find the web report.
Each webpage shows one spatial map thresholded and rendered on top of an example functional scan
followed by the relevant time-course of the ICA decomposition and the
power-spectrum of the time-course. If you click on the
thresholded map, you can inspect the raw IC output
together with probability maps and the Mixture Model
fit. Use previous and next to
view another component map.
Type melodic --help to get usage.